Mediant Partners Ltd was incorporated on 11 May 2026. The GitHub organisation followed sixteen days later, on 27 May. This is the first time we have counted what has happened since, using git, GitHub and aggregate counts from the ZooLog production database, with nothing estimated. No money in it: that is not what this post is for.
195 repos, and an asterisk
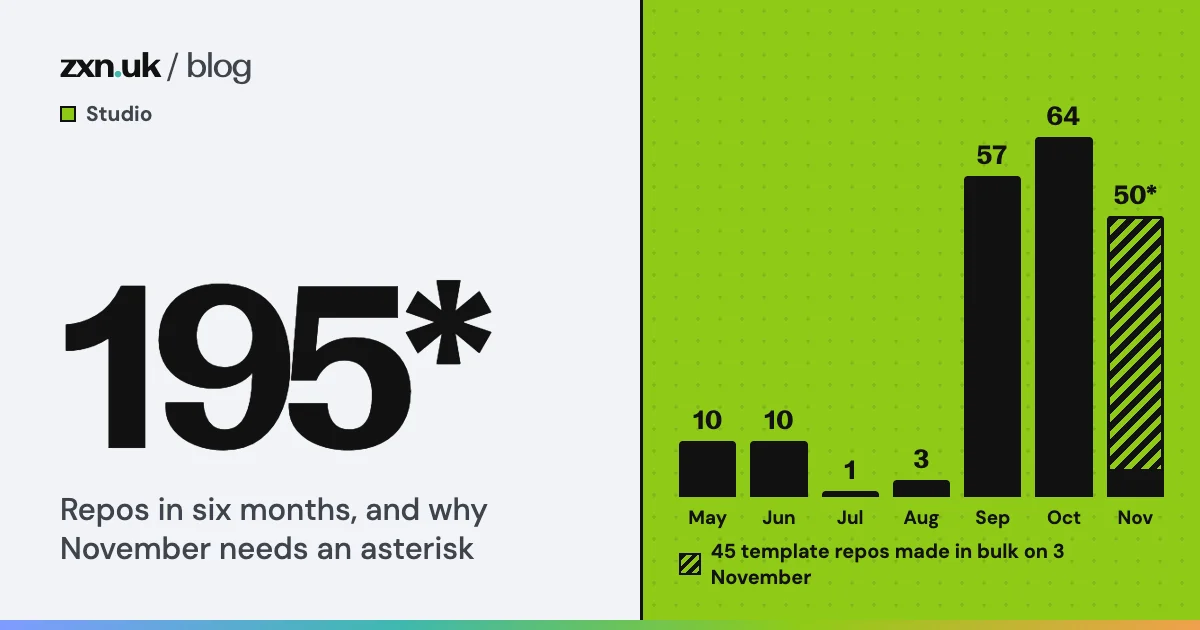
The organisation holds 195 repositories. Here is when each was created.
Repositories created per month
Every repo in the GitHub organisation by creation month. November runs to 6 November.
Source: GitHub organisation listing, 7 November 2026
The summer months are quiet: most of the work happened in a few long-lived product repos. September is when that changed. On 23 September the estate got its own devroot and several of our MCP servers got repos of their own, and from then on “one thing, one repo” became the habit. October’s 64 were mostly real work: 15 websites (what we check before one goes live is in the launch checklist), 9 apps, 9 documentation repos, 8 services, and 5 devroots, most of them on 12 October, when we reorganised into one folder and one devroot per business.
November is the asterisk. Of its 50 repos, 45 were created on 3 November in three bursts, overnight and then over the early afternoon. All 45 follow the same naming pattern, none has a topic yet, and they are template website repos made in bulk, not 45 new clients. Take them out and November has 5. We would rather say that here than let the chart suggest a growth spurt that did not happen.
56 of the 195 are archived. That is the other half of “one thing, one repo”: when a thing ends, its repo is archived rather than left to rot.
ZooLog, measured by what keepers record
ZooLog is our animal records app for zoos and keepers. Commits tell you how busy we were. Logs tell you whether anyone used it.
ZooLog logs recorded per month
Animal logs written in production. November is 1 to 7 November only.
Source: ZooLog production database, aggregate counts, 7 November 2026
Logs nearly tripled from June to September. October came in about 10% below September, the first month that went down. We do not have one clean reason for that, and we are not going to invent one. November’s 191 covers a week. The log, animal, photo and logger counts here exclude our own test and demo use.
The honest reading is that these are early numbers. Twenty-two active loggers across three organisations is a pilot, not a market, and a log is a measure of use, not of income. We count them anyway, because a product that is used by few people and counted honestly teaches more than one that is called a success.
Behind those numbers sit 133 database migrations. The web repo has 1,079 commits since its first on 3 June and 143 tags: 103 web releases and 40 versions of the API contract the apps are built against. The mobile repo has 1,475 commits since 13 July and 154 tags, 104 of them app versions. On the web side that is close to a release every working day.
Where the commits went
Commits per repository
Total commits on main, counted on 7 November 2026.
Source: Git history of each repository, 7 November 2026
TipBop, our tap-to-tip app for hospitality staff, has 765 commits and 292 merged pull requests, and its iOS app is on build 36 of version 1.1.
The two bars that are not products matter as much as the three that are. The estate devroot holds our shared rules, scripts and task tracker, and it reached 1,059 commits in the six weeks since 23 September. Our agent config, the instructions and guard hooks our AI coding agents run under, has 332 commits since 8 September. A lot of what we build is now written by agents with one of us reviewing, and those two repos are where we write down what they are allowed to do and what they keep getting wrong.
The tracker itself has grown to match. On 6 November we copied 2,737 tasks from the Markdown trackers into a native task app we are building for ourselves. The app shows 811 of them as open. The rest are history, and keeping it is the point. How the Markdown files came to be is in We moved every ticket into a Markdown file.
What the next six months should show
If this is working, the next version of this post should look different in three ways.
Repos created per month should fall while commits per repo rise. We have done the splitting; now each repo should get deeper, not the list longer. The 45 template repos should either have become client sites or been archived, so the asterisk goes away.
ZooLog logs should be counted per organisation, not just per month, with more than three organisations to count. One month going down is noise. Two would be a signal, and we will say so if it happens.
And the estate repos should grow more slowly than the products. Rules and guard rails are worth writing, but they are not the thing we sell. If the devroot is still matching ZooLog commit for commit in May 2027, we will have spent too long on the workshop and not enough on the work.